Brook Brokers publishes ongoing Brooklyn market reports focused on multifamily, mixed-use, and development site transactions across the borough. These reports track actual recorded sales, providing insight into pricing trends, transaction volume, and shifts in buyer demand.
Our analysis emphasizes building classes such as walk-up multifamily (C1), elevator buildings (D1), and mixed-use properties, with a focus on how these assets are trading in today’s market environment. Given the current challenges in rent-stabilized assets and the relative strength in mixed-use properties, these reports help owners, investors, and lenders understand where the market is active.
Each report is based on recorded data and supplemented with our interpretation of market conditions, including capital markets activity, financing trends, and deal structure.
Dear Owner / Investor,
Below is a snapshot of the Brooklyn multifamily and mixed-use market, along with select transactions recorded in February 2026.
Multifamily activity remained light. This is not a temporary slowdown—it reflects structural constraints in the market. In the rent-stabilized segment, pricing continues to favor buyers, but a meaningful portion of ownership—estimated at roughly 30%—has little to no equity. These owners are effectively sidelined, which continues to suppress transaction volume. Until more of these assets move through foreclosure or recapitalization, liquidity in this segment will remain limited.
Only seven C1 and one D1 property traded borough-wide during the month. The majority of activity was concentrated in free-market assets. Transaction volume should gradually improve as owners with equity make the decision to exit and redeploy capital into more efficient opportunities.
Mixed-use continues to stand out. Demand remains strong, and the segment is holding up well despite more disciplined underwriting. Recent trades are clustering in the $450–$700 per square foot range, with pricing largely driven by the quality and stability of the retail component.
As we close out the first quarter, next month’s report will provide a clearer read on where the market is heading for the balance of the year.
On our end, we are upgrading the report. The next issue will include additional data summaries and a new section aimed at delivering more actionable insights.
| Address | Neighborhood | Sale Date | Sale Price | Building Size (SF) | Price / SF |
|---|---|---|---|---|---|
| 113 Eagle Street, Brooklyn, NY 11222 | Greenpoint | 02/18/2026 | $2,600,000 | 2,280 | $1,140 |
| 35 Orange Street, Brooklyn, NY 11201 | Brooklyn Heights | 02/18/2026 | $15,850,000 | 47,136 | $336 |
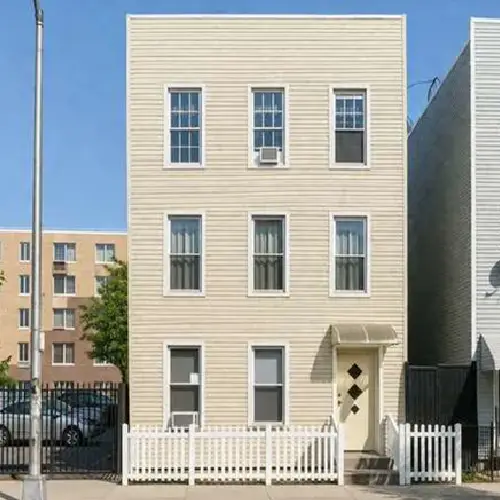
| 334 Dahill Road, Brooklyn, NY 11218 | Borough Park | 02/04/2026 | $2,850,000 | 6,068 | $470 |
| 112 Boerum Street, Brooklyn, NY 11216 | Williamsburg | 02/13/2026 | $2,450,000 | 6,875 | $356 |
| 1764 79th Street, Brooklyn, NY 11214 | Bensonhurst | 02/12/2026 | $1,500,000 | 5,289 | $284 |
| 422 61st Street, Brooklyn, NY 11220 | Sunset Park | 02/12/2026 | $5,000,000 | 16,512 | $303 |
113 Eagle Street, Brooklyn, NY 11222
Greenpoint
35 Orange Street, Brooklyn, NY 11201
Brooklyn Heights
334 Dahill Road, Brooklyn, NY 11218
Borough Park
112 Boerum Street, Brooklyn, NY 11206
Williamsburg
1764 79th Street, Brooklyn, NY 11214
Bensonhurst
422 61st Street, Brooklyn, NY 11220
Sunset Park
| Address | Neighborhood | Sale Date | Sale Price | Building Size (SF) | Price / SF |
|---|---|---|---|---|---|
| 113 Eagle Street, Brooklyn, NY 11222 | Greenpoint | 02/18/2026 | $2,600,000 | 2,280 | $1,140 |
| 35 Orange Street, Brooklyn, NY 11201 | Brooklyn Heights | 02/18/2026 | $15,850,000 | 47,136 | $336 |
| 334 Dahill Road, Brooklyn, NY 11218 | Borough Park | 02/04/2026 | $2,850,000 | 6,068 | $470 |
| 112 Boerum Street, Brooklyn, NY 11216 | Williamsburg | 02/13/2026 | $2,450,000 | 6,875 | $356 |
| 1764 79th Street, Brooklyn, NY 11214 | Bensonhurst | 02/12/2026 | $1,500,000 | 5,289 | $284 |
| 422 61st Street, Brooklyn, NY 11220 | Sunset Park | 02/12/2026 | $5,000,000 | 16,512 | $303 |
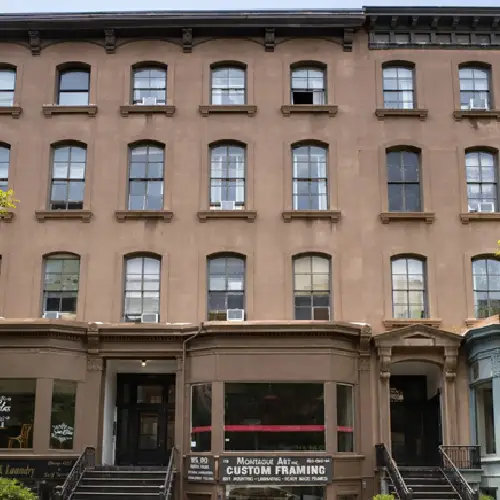
140 Montague Street, Brooklyn, NY 11201
Brooklyn Heights
150 Lee Avenue, Brooklyn, NY 11211
Williamsburg
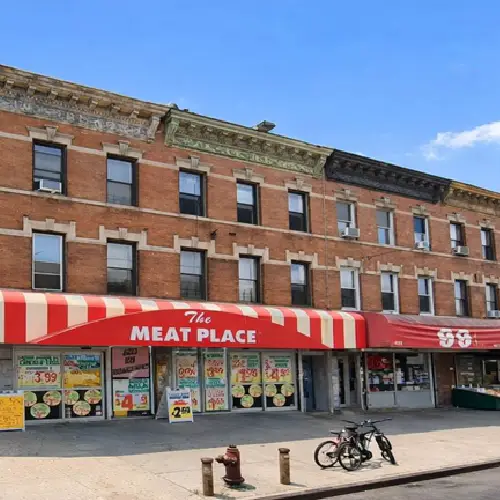
7203 13th Avenue, Brooklyn, NY 11228
Dyker Heights
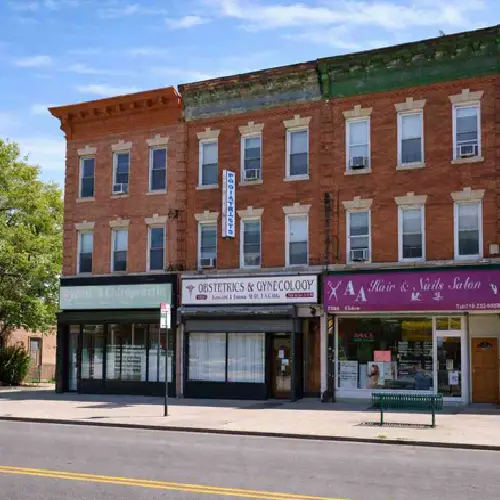
1421 – 1423 Nostrand Avenue, Brooklyn, NY 11226
Bedford Stuyvesant
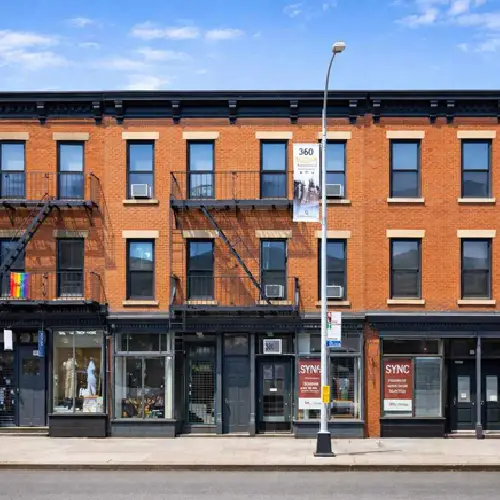
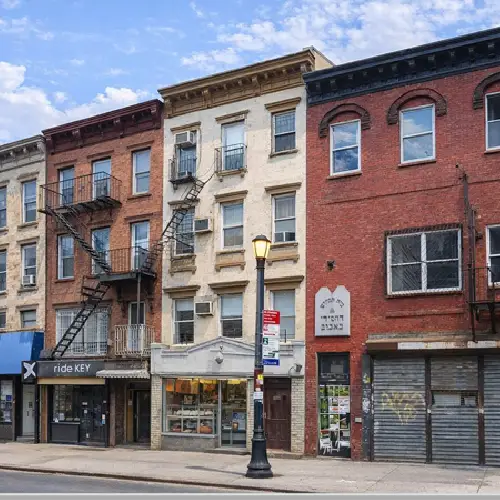
360 Atlantic Avenue, Brooklyn, NY 11217
Boerum Hill
101 – 107 5th Avenue, Brooklyn, NY 11217
Park Slope
Brooklyn Market Overview
Over the past 45 days, Brooklyn’s real estate capital markets have shown a selective but improving tone, with lenders still favoring well-located, stabilized assets and high-quality development stories. The strongest financing activity has clustered around multifamily, especially in supply-constrained neighborhoods and institutional-quality projects, where borrowers have been able to secure large refinancing loans despite a still-elevated cost of capital. Recent transactions in Downtown Brooklyn and Gowanus point to continued lender confidence in assets with strong occupancy, modern construction, and clear leasing momentum.
At the same time, the Brooklyn capital markets remain fragmented rather than broadly loose. Prime deals are getting done, but pricing is tighter, and borrowers often need to contribute more equity or accept higher debt costs than they would have a few years ago. Retail and smaller commercial assets are still more challenging, while multifamily and select development properties are attracting the most attention. Overall, Brooklyn is seeing real capital flow, but only for assets that can prove stability, sponsorship strength, and a believable path to value creation.
With 20+ years of experience and hundreds of successful deals, we are here to help. Reach out today for expert guidance on your next real estate move.